Stock Market Terminology: The Beginner’s Guide to Investing
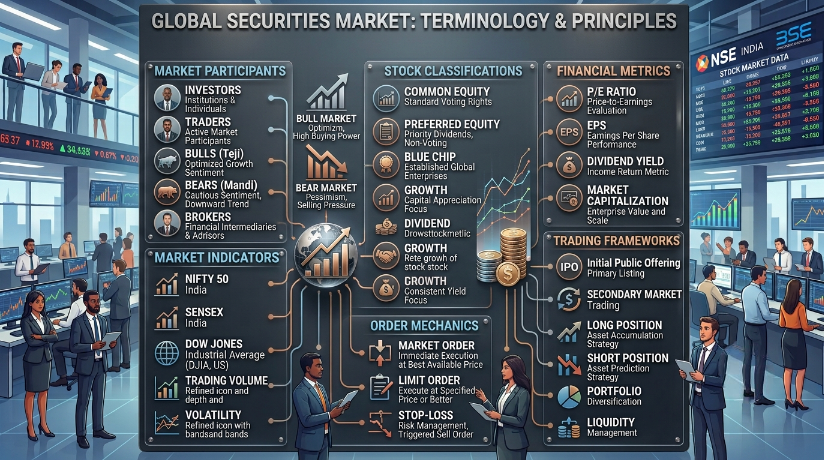
Ever sat in on a conversation about investing and felt completely lost? You’re not alone. Stock market terminology can feel like a secret language reserved for Wall Street insiders. But here’s the truth: once you crack the code, it’s a lot less intimidating than it seems. This guide walks you through the essential vocabulary of investing, one plain-English explanation at a time.
Whether you’re opening your first brokerage account or just trying to understand what your coworker means by “the market’s overbought,” this article has you covered. We’ll skip the jargon-on-jargon explanations and instead use real-world analogies you can actually picture. By the end, you’ll be reading financial news without reaching for a dictionary every five seconds.
Let’s dive right into the world of stock market terminology and make it make sense.
Why Understanding Stock Market Terminology Matters
Think about learning a new sport. You could technically watch a soccer match without knowing what “offside” means, but you’d miss half the drama. Investing works the same way. Without a grip on basic stock market terminology, you’re watching the game without understanding the rules.
Financial literacy isn’t just a nice-to-have anymore. It’s practically a survival skill. Retirement accounts, home purchases, and even everyday budgeting decisions often hinge on understanding how markets move and why. And honestly, a lot of people avoid investing altogether simply because the language feels like a wall they can’t climb.
Here’s the good news, though. Most stock market terminology boils down to a handful of core ideas repeated in different forms. Once those click, everything else starts falling into place surprisingly fast. So let’s start building that foundation, term by term.
The Building Blocks: Stocks, Shares, and Equity
What Exactly Is a Stock?
A stock represents a small slice of ownership in a company. When you buy one share of a company, you literally own a tiny piece of that business. If the company grows and becomes more valuable, your slice grows in value too. If it struggles, well, your slice shrinks right along with it.
Picture a pizza cut into a million slices. Buying one share is like grabbing a single slice of that pizza. You don’t own the whole pie, but you’re entitled to a proportional bite of whatever the company earns or loses. That’s the entire concept of equity in a nutshell.
Shares Outstanding and Market Capitalization
Shares outstanding simply means the total number of slices that pizza has been cut into. Multiply that number by the current share price, and you get market capitalization, often shortened to “market cap.” This figure tells you roughly how big a company is in the eyes of investors.
Companies typically fall into categories like large-cap, mid-cap, and small-cap based on this number. Large-cap companies, think Apple or Microsoft, tend to be steadier but grow more slowly. Small-cap companies can be riskier, yet they sometimes offer bigger growth potential. Knowing where a stock falls on this spectrum helps you gauge both risk and opportunity before you buy in.
Market Movements: Bull, Bear, and Everything Between
Bull Markets Explained
A bull market describes a period when stock prices are generally rising and investor confidence is high. The term supposedly comes from how a bull attacks, thrusting its horns upward. It’s a handy visual, honestly, because that’s exactly what prices do during these stretches.
During a bull market, optimism tends to feed on itself. Rising prices attract more buyers, which pushes prices higher still. It’s a bit like a snowball rolling downhill, gathering size and speed as it goes. Of course, nothing rolls forever, and eventually momentum shifts.
Bear Markets and Corrections
A bear market is the opposite story, marked by falling prices and widespread pessimism. Just like a bear swipes its paws downward, prices in this phase tend to slide. Officially, a bear market kicks in when stocks drop 20% or more from recent highs.
A correction, meanwhile, is a smaller dip, typically a decline of 10% or so. Corrections happen far more often than full bear markets and usually resolve within a few months. Think of a correction as a stumble, while a bear market is closer to a full fall. Both are normal parts of investing, even though they rarely feel that way in the moment.
Reading the Numbers: Key Financial Metrics
Price-to-Earnings Ratio (P/E Ratio)
The price-to-earnings ratio, or P/E ratio, compares a company’s stock price to its earnings per share. In simple terms, it tells you how much investors are willing to pay for each dollar of profit. A high P/E often signals that investors expect strong future growth, while a low one might suggest the stock is undervalued or facing challenges.
Let’s use a quick example. If a company’s stock trades at $50 and its earnings per share are $5, the P/E ratio is 10. That means investors are paying ten times the company’s annual earnings for a share. Comparing this ratio across similar companies can reveal whether a stock is priced fairly relative to its peers.
Dividend Yield
Dividend yield measures how much a company pays shareholders in dividends relative to its stock price, expressed as a percentage. Not every company pays dividends, but for those that do, this figure matters a lot to income-focused investors. It’s essentially the “rental income” of owning a stock, separate from any gains through price appreciation.
Say a stock costs $100 and pays $4 annually in dividends. That’s a 4% dividend yield, which many retirees and conservative investors find appealing. Higher yields can look tempting, but they sometimes signal trouble, since a falling stock price mathematically boosts the yield even if nothing about the business improved.
Earnings Per Share (EPS)
Earnings per share divides a company’s total profit by its number of outstanding shares. It’s one of the simplest yet most closely watched metrics in stock market terminology because it directly reflects profitability on a per-share basis. Analysts obsess over EPS reports every quarter, and stock prices often swing wildly based on whether a company beats or misses expectations.
Keep in mind that EPS alone doesn’t tell the whole story. A company could boost EPS by buying back shares rather than actually growing profits. That’s why savvy investors always look at EPS alongside other metrics rather than in isolation.
Order Types and Trading Mechanics
Market Orders vs. Limit Orders
A market order tells your broker to buy or sell a stock immediately at the best available price. It’s fast and reliable but offers no control over the exact price you’ll pay or receive. Think of it like ordering a taxi and telling the driver, “just go, I’ll pay whatever the meter says.”
A limit order, on the other hand, sets a specific price you’re willing to accept. If the stock never reaches that price, the trade simply doesn’t happen. This gives you more control but sacrifices the guarantee of execution. Many new investors default to market orders for simplicity, then graduate to limit orders once they want tighter control over their trades.
Stop-Loss Orders
A stop-loss order automatically sells a stock once it drops to a predetermined price, helping limit potential losses. Imagine setting a safety net beneath a tightrope walker. If things go wrong, the net catches the fall before it becomes catastrophic. That’s essentially what a stop-loss does for your portfolio.
Traders love this tool because it removes emotion from the equation. Instead of panicking and freezing during a sudden drop, the stop-loss executes the sale automatically. It’s not foolproof, since prices can gap down past your stop level during volatile periods, but it remains one of the most practical risk-management tools in a trader’s kit.
Volatility, Liquidity, and Risk
What Volatility Really Means
Volatility measures how dramatically a stock’s price swings over a given period. High volatility means big, sometimes rapid price changes, while low volatility suggests steadier, more predictable movement. Neither is inherently good or bad, but each suits different types of investors and strategies.
A useful analogy: volatility is like weather versus climate. A calm, sunny stock barely moves day to day, while a stormy one whips around unpredictably. Some traders thrive on that storm, chasing quick profits from sharp swings. Others prefer calmer skies and steadier, long-term growth.
Liquidity and Why It Matters
Liquidity refers to how easily a stock can be bought or sold without significantly affecting its price. Large, well-known companies like Amazon or Coca-Cola tend to have high liquidity, meaning you can trade shares almost instantly at a fair price. Smaller, less popular stocks can be far less liquid, making trades slower and pricier.
Picture trying to sell a popular smartphone versus a rare vintage typewriter. The smartphone sells in minutes at a known price. The typewriter might take weeks to find the right buyer, and the final price is anyone’s guess. That’s the essence of liquidity in the stock market.
Portfolio and Investment Strategy Terms
Diversification
Diversification means spreading your investments across different assets, sectors, or regions to reduce risk. The old saying “don’t put all your eggs in one basket” fits perfectly here. If one basket falls, you haven’t lost everything, just a portion.
A well-diversified portfolio might include stocks from different industries, along with bonds, real estate, and perhaps even international investments. This approach won’t eliminate risk entirely, but it definitely softens the blow when any single investment underperforms. Financial advisors consistently rank diversification among the most important stock market terminology concepts for beginners to grasp early.
Asset Allocation
Asset allocation refers to how you divide your investment portfolio among different asset classes, such as stocks, bonds, and cash. Younger investors often lean heavily toward stocks since they have more time to recover from downturns. Those closer to retirement typically shift toward bonds and cash for stability.
There’s no one-size-fits-all formula here, since allocation depends on your goals, timeline, and comfort with risk. A 25-year-old saving for retirement decades away can usually afford more aggressive positioning than someone planning to retire next year. Reviewing and adjusting your allocation periodically keeps your strategy aligned with your changing life circumstances.
Blue-Chip Stocks
Blue-chip stocks belong to large, financially sound companies with a long history of reliable performance. The term reportedly comes from poker, where blue chips traditionally hold the highest value at the table. Companies like Johnson & Johnson or Procter & Gamble often get this label.
These stocks aren’t usually flashy, but they’re dependable. Investors often turn to blue-chip stocks during uncertain times because these companies have weathered previous downturns and tend to bounce back. They won’t make you rich overnight, but they can anchor a portfolio with steady, long-term growth.
Indexes and Benchmarks
Stock Market Indexes
A stock market index tracks the performance of a specific group of stocks, serving as a benchmark for the broader market. The S&P 500, for instance, tracks 500 of the largest publicly traded U.S. companies. The Dow Jones Industrial Average follows 30 major companies, while the Nasdaq Composite leans heavily toward technology firms.
Indexes matter because they give investors a quick snapshot of overall market health. Instead of tracking thousands of individual stocks, you can glance at the S&P 500’s daily movement and get a reasonable sense of how the broader market performed. Many beginner investors also choose index funds, which simply mirror these benchmarks rather than trying to beat them.
Bull vs. Bear in Index Context
When people say “the market is up,” they’re usually referencing one of these major indexes. This shorthand ties directly back to earlier stock market terminology like bull and bear markets. A sustained rise across major indexes typically signals a bull market, while a prolonged, broad decline points toward bear territory.
Understanding this connection helps you interpret financial headlines more accurately. News anchors often toss around terms like “the Dow fell 300 points today” without context. Knowing what these indexes represent turns that headline from confusing noise into meaningful information you can actually use.
Conclusion: Turning Confusion Into Confidence
Learning stock market terminology isn’t about memorizing a textbook glossary. It’s about building a mental toolkit that helps you make sense of financial news, evaluate investment opportunities, and manage risk with confidence. Every term covered here, from P/E ratios to stop-loss orders, plays a role in the bigger picture of smart investing.
The stock market will always have its share of unpredictability, and no amount of vocabulary changes that. But understanding the language behind the numbers puts you in a far stronger position to make informed decisions rather than guessing blindly. That confidence alone can be the difference between panicking during a downturn and staying the course toward your long-term goals.
If you’re just starting out, don’t try to absorb everything at once. Pick a few terms each week, apply them to real headlines or your own portfolio, and let the concepts sink in naturally. Before long, stock market terminology won’t feel like a foreign language anymore. It’ll simply be the way you talk about your money.
Frequently Asked Questions
1. What’s the easiest way to start learning stock market terminology?
Start small by focusing on five or six core terms, like stock, dividend, and volatility, before moving to more advanced concepts. Reading financial news daily and looking up unfamiliar words as you go builds vocabulary naturally over time.
2. Is a high P/E ratio always a bad sign?
Not necessarily. A high P/E ratio often reflects strong growth expectations rather than overvaluation alone. It’s more useful to compare a company’s P/E against industry peers than to judge it in isolation.
3. What’s the difference between a stock and an index fund?
A stock represents ownership in a single company, while an index fund holds a basket of many stocks that mirror a specific market index. Index funds generally offer built-in diversification that a single stock can’t provide.
4. How does volatility affect long-term investors differently than day traders?
Long-term investors can often ride out volatility since they have time to recover from short-term swings. Day traders, however, actively seek out volatility because it creates opportunities for quick, short-term profits.
5. Why do beginners need to understand market orders and limit orders?
Knowing the difference helps you control both the speed and price of your trades. A market order prioritizes speed, while a limit order prioritizes price precision, and choosing correctly can save you money over time.


Post Comment